
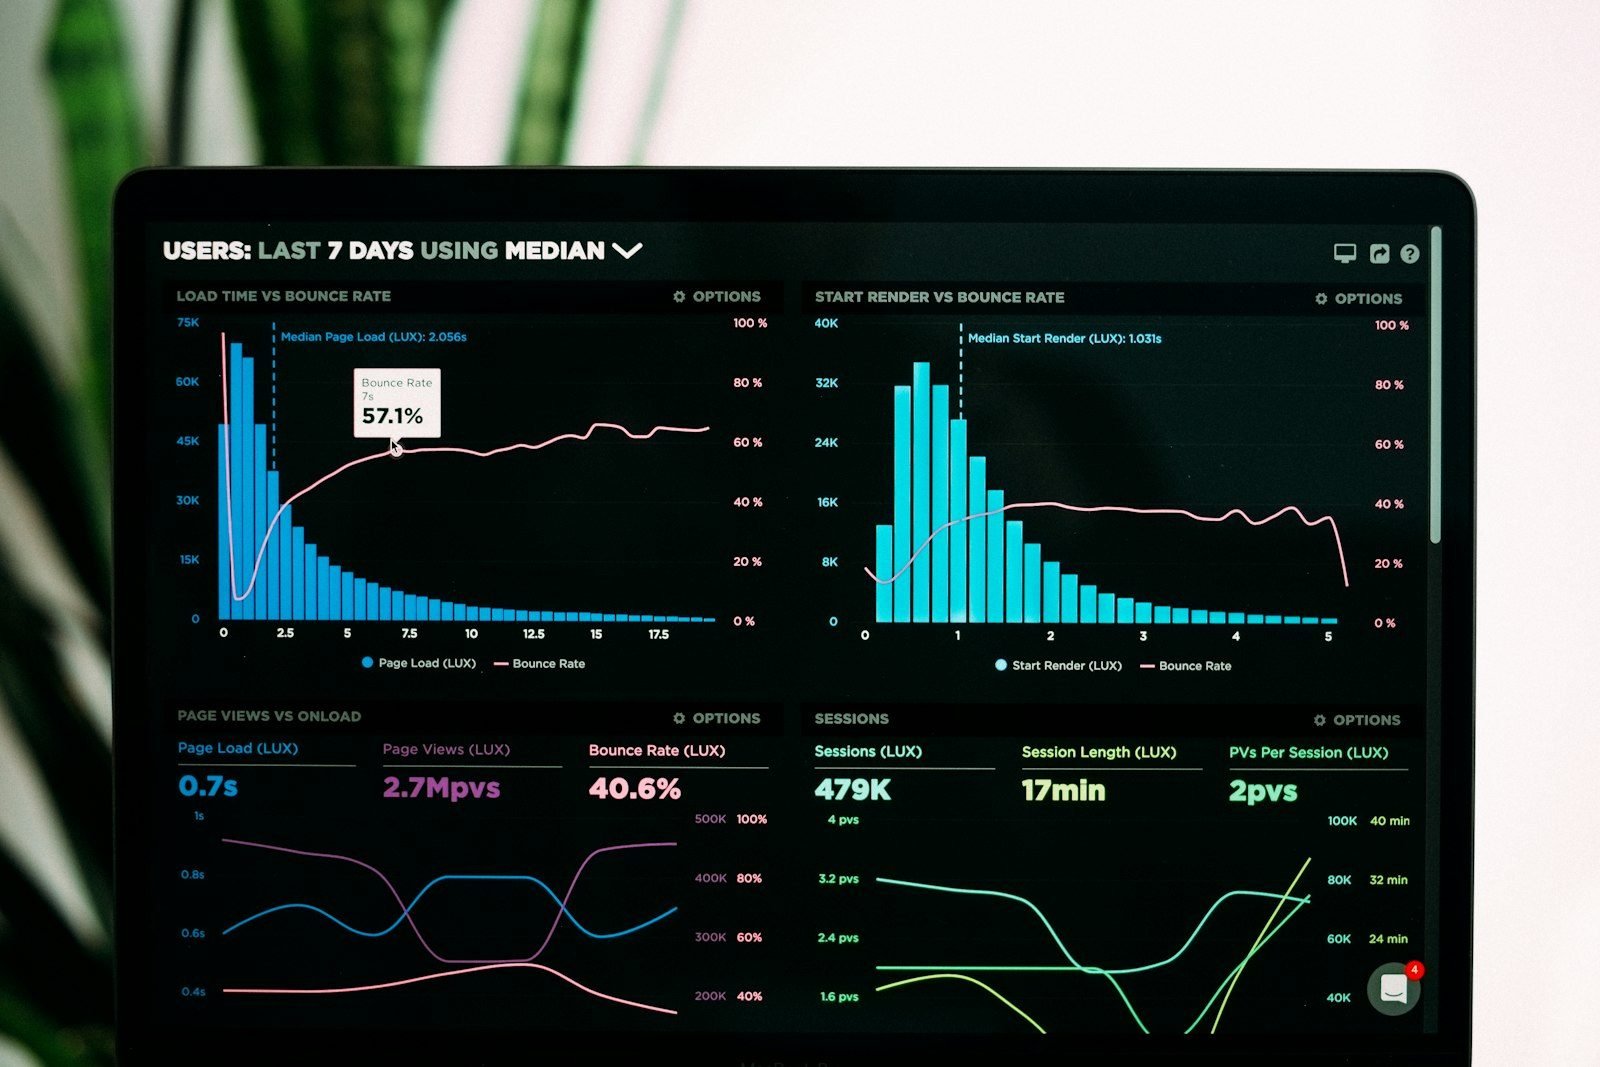
Most teams do not lack data. They lack a short list of numbers they trust enough to make a decision with.
Start from the business, not the tool
Begin with the outcome: enquiries, bookings, sales, qualified applications. Work backwards to the events that produce them — a form submitted, a call placed, a checkout completed. Only those events belong on the main dashboard.
Everything else is diagnostic: you look at it when the primary number moves unexpectedly.
Distinguish leading from lagging
Traffic is leading. Revenue is lagging. If you report only lagging indicators, you find out too late; if you report only leading indicators, you can celebrate activity that never converts.
Pair them. A rising click-through rate with a flat enquiry rate tells you the problem is the page, not the campaign.
Beware of platform-reported numbers
Advertising platforms report in ways that flatter themselves. Use them for optimisation signals, but reconcile against your own analytics for reporting. Differences between the two are information, not noise.
Fewer metrics, more decisions
A useful monthly report fits on one page and ends with actions:
- What we expected
- What happened
- Why we think it happened
- What we are changing next
If a metric never changes a decision, remove it. The goal is not comprehensive measurement — it is measurement you act on.


